
Flood zone data is defined as the classification of land parcels by FEMA and related agencies according to their statistical probability of flooding, and it directly determines property values, insurance costs, and development feasibility for real estate investors. Understanding how flood zone data affects investment strategy is not optional for serious investors. Residential properties in 100-year floodplains carry sustained price discounts of 10%–10.8%, and those discounts often persist for 15 or more years. Flood zone classification and legal factors drive over 61% of variance in commercial real estate investment willingness. That single figure tells you flood risk is not a footnote in your underwriting. It is the headline.
How flood zone data affects investment strategy through property values
Flood zone data reshapes property values in ways that most investors underestimate until they are already under contract. The 10%–10.8% price discount in high-risk zones is not a temporary market reaction. Research confirms the depreciation persists for 15 or more years, which means you are not buying a distressed asset with a clear recovery path. You are buying a structurally discounted asset in a market that has priced in permanent risk.
Buyer behavior compounds the problem. Flood-affected homes sell more slowly and are held longer by their owners. That extended ownership pattern signals reduced liquidity, which matters when you model your exit. A property that takes longer to sell and attracts fewer qualified buyers is a harder asset to flip and a riskier one to hold.

The shift from binary FEMA flood zone maps to granular hazard scores is changing how markets price risk. Granular hazard scores produce up to 37% price impact in markets where detailed risk data is publicly accessible. That spread between binary-map pricing and granular-score pricing is where informed investors find their edge.
| Flood zone classification | Typical value impact | Liquidity effect |
|---|---|---|
| Zone X (minimal risk) | No discount | Normal market velocity |
| Zone AE (100-year floodplain) | 10%–10.8% discount | Slower sales, longer hold periods |
| Zone VE (coastal high hazard) | 10%+ discount plus construction premium | Significantly reduced buyer pool |
| Remapped out via LOMA | 10%–20% value recovery | Improved liquidity and buyer access |
- Properties in Zone AE face both value discounts and mandatory insurance requirements, compressing returns from two directions.
- Granular hazard scores reveal risk gradients within the same zip code, allowing investors to identify underpriced parcels on the safer edge of a flood zone.
- Extended hold periods in flood-affected areas reduce IRR even when the purchase price reflects the discount.
- Distressed property evaluation must account for flood zone classification before any valuation model is finalized.
Pro Tip: Request the FEMA Flood Insurance Rate Map (FIRM) panel number for any target property and cross-reference it with the most recent granular hazard score data available for that county. Binary zone maps alone will leave money on the table.
What flood insurance costs do to cash flow and feasibility
Mandatory flood insurance in high-risk zones adds $1,000–$5,000 annually to operating expenses. That range sounds manageable until you model what it does to buyer purchasing power. A $3,000 annual premium reduces purchasing power by approximately $35,000–$40,000. For a rental property, that same premium reduces net operating income and compresses your cap rate.
FEMA's Risk Rating 2.0 system, introduced to replace the old community-based pricing model, now assigns premiums based on property-specific risk factors including elevation, distance to water, and foundation type. Premiums are projected to escalate 8%–15% annually over the next decade under this system. Investors who model today's premium as a fixed expense will face cash flow shortfalls within three to five years.
Private flood insurance exists for commercial assets and offers higher policy limits than the National Flood Insurance Program (NFIP), which caps residential coverage at $250,000 for the structure. Commercial investors with assets above that threshold must source private coverage, which introduces underwriting variability and potential coverage gaps.
Key insurance cost implications for your pro forma:
- Rental properties: Annual premium increases of 8%–15% erode NOI progressively. Model at least a 10-year premium trajectory before setting rent thresholds.
- Fix-and-flip properties: Higher insurance costs reduce the buyer pool, extend days on market, and compress your resale margin.
- Commercial assets: NFIP limits are insufficient for most commercial structures. Private flood insurance adds cost and complexity to the capital stack.
- Refinancing risk: Lenders require proof of flood insurance at closing and at every renewal. A lapse or a premium spike can trigger a loan covenant issue.
Pro Tip: When underwriting a flood zone property, run three insurance cost scenarios: current premium, 8% annual escalation, and 15% annual escalation. The gap between those scenarios will tell you whether the deal survives a decade of Risk Rating 2.0 increases.
Construction and remediation costs in high-hazard flood zones
Construction cost premiums in Zone VE and Zone AE are not minor line items. Hard costs in VE zones can reach 25%–50% above standard construction costs due to elevation requirements, specialized foundation systems, and flood-resistant materials. That premium directly affects your debt service coverage ratio and the rent level required to make a project pencil.
Flood mitigation investments, including elevation certificates, flood vents, and structural elevation, carry a measurable return. Properties with documented flood mitigation improvements show a 10.7% value premium over comparable unmitigated properties in the same flood zone. That premium effectively offsets a significant portion of the original flood discount, making mitigation a value-add strategy rather than just a compliance cost.
| Mitigation measure | Estimated cost | Value impact |
|---|---|---|
| Elevation certificate | $500–$1,500 | Required for LOMA; enables insurance reduction |
| Structural elevation (1–2 feet) | $20,000–$60,000 | Reduces premium; supports 10.7% value premium |
| Flood vents installation | $2,000–$8,000 | Lowers insurance cost; improves lender comfort |
| LOMA application | $500–$2,000 | 10%–20% value recovery; removes mandatory insurance |
The feasibility math changes when you treat mitigation as a capital investment rather than a sunk cost. A $30,000 elevation project that generates a 10.7% value premium on a $400,000 property adds $42,800 in value. The net gain exceeds the mitigation cost before you factor in insurance savings.
Pro Tip: Get an elevation certificate before closing on any property in Zone AE or VE. The certificate costs under $1,500 and gives you the data needed to pursue a LOMA, reduce insurance premiums, and negotiate a better purchase price if the elevation is favorable.
How investors use granular flood data to sharpen their decisions
The shift from binary FEMA flood zone designations to granular hazard scores represents a real competitive advantage for investors who act on it early. Binary maps classify a parcel as inside or outside a flood zone. Granular hazard scores assign a numeric risk level that reflects actual elevation, drainage patterns, and historical flood frequency. Markets with accessible granular data price risk more accurately, with up to 37% price variation between high-score and low-score parcels within the same nominal flood zone.
Letters of Map Amendment (LOMA) and Letters of Map Revision (LOMR) are the most direct tools for converting flood zone liability into value. A successful LOMA removes a property from the Special Flood Hazard Area (SFHA) designation, eliminating mandatory insurance and the flood stigma that suppresses buyer demand. LOMA applications cost $500–$2,000 and can increase property values by 10%–20%. That is one of the highest-ROI administrative actions available in real estate.
Cross-referencing flood zone data with local net migration trends adds another layer of signal. Markets with strong inbound migration absorb flood risk discounts faster because demand pressure compresses the discount over time. Markets with flat or negative migration hold the discount longer. Municipal data analysis that combines flood zone classification with population flow data gives investors a forward-looking view of where discounts will compress and where they will deepen.
Practical steps for using granular flood data in your investment process:
- Pull the FEMA FIRM panel and the county-level hazard score for every target property before submitting an offer.
- Screen for LOMA eligibility on any property where the elevation certificate shows the lowest adjacent grade above the Base Flood Elevation.
- Model insurance premium escalation at 8%–15% annually in your 10-year pro forma, not as a fixed cost.
- Cross-reference flood zone classification with net migration data to assess whether the local market will absorb or deepen the flood discount over your hold period.
Pro Tip: Property distress scoring tools that incorporate flood zone overlays let you filter opportunity lists before you spend time on site visits. Flood risk is a public record signal. Use it at the top of your funnel, not at the bottom.
Key Takeaways
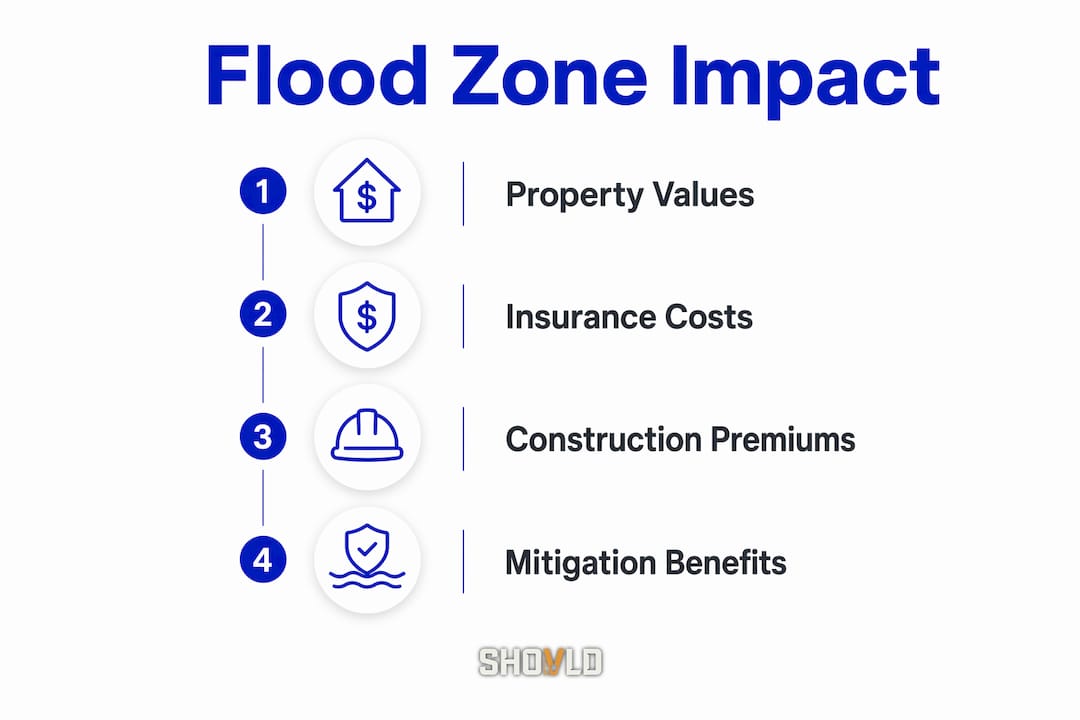
Flood zone data shapes investment returns through property value discounts, insurance cost escalation, and construction premiums that compound over a typical hold period.
| Point | Details |
|---|---|
| Value discounts are permanent | High-risk flood zones carry 10%–10.8% price discounts that persist for 15 or more years. |
| Insurance costs compound | Risk Rating 2.0 premiums escalate 8%–15% annually; model a 10-year trajectory in every pro forma. |
| Mitigation generates returns | Documented flood mitigation yields a 10.7% value premium, often exceeding the cost of the work. |
| LOMA is high-ROI | A $500–$2,000 LOMA application can recover 10%–20% of property value by removing mandatory insurance. |
| Granular data beats binary maps | Hazard scores reveal up to 37% price variation within a single flood zone, creating pricing edges for informed investors. |
Flood zone data deserves a place at the top of your underwriting stack
I have reviewed enough real estate deals to know that flood zone risk gets treated as a closing checklist item far too often. Investors pull the FEMA map, confirm the zone, note the insurance requirement, and move on. That approach misses the compounding problem entirely.
The investors I have seen get hurt by flood zone exposure were not uninformed. They knew the property was in Zone AE. What they did not model was the 10-year insurance premium trajectory under Risk Rating 2.0. A deal that cash-flowed at acquisition looked very different five years later when premiums had escalated 12% per year. The math was always there. They just did not run it.
The structural cost premiums in VE zones are equally underestimated. A 25%–50% hard cost premium does not just affect your construction budget. It raises the rent threshold required to service debt, which shrinks your tenant pool in markets where comparable rents are already set by unencumbered properties. You are competing against landlords with lower cost bases.
My strongest recommendation is to treat flood zone due diligence as a first-pass filter, not a final-step confirmation. Screen for flood zone classification before you analyze comps, before you model rents, and before you engage a broker. If the zone is AE or VE, immediately assess LOMA eligibility and model mitigation costs as a value-add line item. Flood resilience upgrades are not just defensive. They are one of the few capital investments in real estate that simultaneously reduce operating costs, increase asset value, and expand your buyer pool at exit.
— Avi
Shovld gives investors flood risk signal before the market moves
Real estate investors who act on flood zone data early hold a clear advantage over those who discover the risk at closing. Shovld's AI-powered platform aggregates public-record signals, including flood zone classifications, permit activity, and distressed-property indicators, across multiple U.S. markets. Opportunity scores incorporate flood zone overlays so you can filter and rank targets before committing time to site visits or broker calls.

Investors using Shovld identify properties where LOMA eligibility, mitigation potential, and market demand signals align before those opportunities become crowded. The platform tracks the public-record data that most investors only review at the due diligence stage. Review Shovld's pricing plans to see how flood risk analytics and opportunity scoring fit your acquisition workflow.
FAQ
What is a FEMA flood zone and why does it affect property value?
A FEMA flood zone is a geographic classification indicating a parcel's statistical flood risk, with Special Flood Hazard Areas (Zone AE, Zone VE) carrying mandatory insurance requirements. Properties in these zones carry sustained price discounts of 10%–10.8% that often persist for 15 or more years.
How does Risk Rating 2.0 change flood insurance costs for investors?
FEMA's Risk Rating 2.0 assigns premiums based on property-specific risk factors rather than community-wide averages, with annual increases projected at 8%–15% over the next decade. Investors who treat today's premium as a fixed cost risk cash flow shortfalls within three to five years.
What is a LOMA and how much value can it recover?
A Letter of Map Amendment (LOMA) is a formal FEMA determination that removes a specific property from the Special Flood Hazard Area designation. A successful LOMA application, which costs $500–$2,000, can increase property value by 10%–20% by eliminating mandatory insurance and flood stigma.
Do flood mitigation improvements actually increase property value?
Documented flood mitigation investments, such as structural elevation and flood vents, generate an average 10.7% property value premium over comparable unmitigated properties in the same flood zone. That premium frequently exceeds the cost of the mitigation work itself.
How do granular hazard scores differ from standard FEMA flood maps?
Standard FEMA maps classify parcels as inside or outside a flood zone using binary designations. Granular hazard scores assign numeric risk levels based on elevation, drainage, and flood history, producing up to 37% price variation between parcels within the same nominal zone.